Debugging the TypeScript Codebase
When I joined the TypeScript team, debugging quickly became my most valuable skill, and by the same token, the debugability of the compiler became one of the codebase’s most valuable assets. The TypeScript compiler is just a Node app so it’s pretty easy to debug, but I’ve found a few useful tricks specific to the TypeScript codebase. Thanks to a request over Twitter, here they are.
The first section of this post is like a quick-start: I’ll get you a debug session running as quickly as possible. If you’re already somewhat familiar with the compiler, this might be all you need. But if you find yourself struggling to navigate that debug session or figure out what part of the code you want to debug, hang in there! The second section provides tips for finding strategic breakpoint locations and inspecting the compiler state while paused.
Quick-Start: Three Ways to Attach
The first step for any method of debugging is to clone and build TypeScript from source so we can step through the original TypeScript source instead of the bundled JavaScript files.
git clone git@github.com:microsoft/TypeScript.git
cd TypeScript
npm install
npm run build
Debugging from tsc
The built compiler and source maps are now in built/local, including a file called tsc.js. Anywhere you would normally use tsc, you can now use node built/local/tsc.js. For example:
$ node --inspect-brk built/local/tsc.js -p ../MyBuggyProject

Debugger listening on ws://127.0.0.1:9229/60b1b25a-f29d-4568-8619-b5e29b6dee25
For help, see: https://nodejs.org/en/docs/inspector
Node is paused at the beginning of tsc.js and waiting for you to attach the debugger of your choice. I’ll be demonstrating use of VS Code’s built-in debugger[1], but any Node debugger that can attach to a listening debug port will work.
If you haven’t already, open the TypeScript codebase in VS Code. Open the command palette and select “Debug: Attach to Node Process,” then select the process you just started (on port 9229 by default).

VS Code will open tsc.js and show that the debugger is paused on the first line. From here, you can continue or step the debugger and hit breakpoints in the TypeScript source files.[2]
Debugging from TS Server
If you need to debug a language service feature (like a refactor, a code fix, the formatter, or code completion), debugging VS Code’s TS Server instance is often the most convenient approach. Again, you’ll need the TypeScript codebase cloned, built, and opened in one VS Code window. You’ll also need another VS Code window opened to a project of your choice. (I have a dedicated project filled with nonsense TypeScript and JavaScript files for this purpose.) We’ll use the former VS Code window to debug the latter. (Impressively, a single VS Code instance can debug its own TS Server process, but TypeScript-powered editor features like go-to-definition don’t work while the process is paused, so it’s much easier to use two windows.)
The window you want to debug needs to be opened with the environment variable TSS_DEBUG set to a port number. If you have the code CLI tool, you can do this from the command line:
cd example-project
TSS_DEBUG=9559 code .
January 2020 update: I recently published a VS Code extension that can restart an open window’s TS Server process with a debug port listening. Could save you a step!
Next, you need to tell that VS Code window where to find the version of TypeScript that you built locally so it can be used for TS Server. Create or modify your example project’s .vscode/settings.json file with the following setting:
{
	"typescript.tsdk": "../path/to/TypeScript/built/local"
}
Now, back in the window with the TypeScript codebase, open the command palette and select “Debug: Attach to Node Process,” then select the process running on the port you selected for TSS_DEBUG.
This time, you’re connected to a long-running process that’s not paused. To pause on something useful, you’ll need to set a breakpoint in an interesting function and trigger that function from your example project window. A good place to start is services.ts. As an example, to step through quick info generation, set a breakpoint in the function called getQuickInfoAtPosition, then in the example project window, hover a variable in a TypeScript or JavaScript file. The debugger in the other window should pause on that breakpoint.

Debugging tests
The last method of debugging I’ll cover is perhaps the most expedient of all, especially if you’re working on actually contributing a bug fix or feature to the compiler. To do so, you’ll of course want to write tests, and it turns out that debugging those tests is really easy.
All the files in tests/cases/compiler and tests/cases/conformance are just snippets of TypeScript (or JavaScript) that the compiler runs against. You won’t find any assertions in them; instead, info about how the compiler runs on these snippets is saved to tests/baselines/reference, and the assertion is that future compilations always match the info saved there. (This is exactly the same concept as snapshot testing, which you might be familiar with in Jest.)
The TypeScript codebase includes a VS Code debugger configuration file for working with these files. To use it, simply copy .vscode/launch.template.json to .vscode/launch.json. Set breakpoints in the part of the compiler you’re interested in (I’ll cover some tips on how to find this shortly), then, open any test file in tests/cases/compiler or tests/cases/conformance (or tests/cases/fourslash, but those can be a bit trickier). Open VS Code’s debug panel, and click the play button. After a few moments, you should hit your first breakpoint.
Going Deeper: Debugging Strategies
Now you know the mechanics of how to start debugging, but how do you debug productively? Stepping through every line of a typical TypeScript compiler run would take… tens of hours, perhaps? How do you determine the relevant parts?
Brief Architecture Review
The answer is that it comes with time spent in the codebase, but having a high-level understanding of the organization of the compiler helps.
Earlier, we saw how to debug tsc and the language service. These are the two most common entry points into the compiler. In a code editor scenario, as we saw before, the language service sits behind TS Server, which translates messages into language service calls. If you want to debug an editor-related feature like a code fix (e.g., inserting a missing await), the place to start is in the functions returned by createLanguageService in services.ts. Otherwise, you’re probably interested in the core compiler, which is invoked both by the language service and by tsc.
Both tsc and the language service use the Program object as the entryway into the core of the compiler. It takes some configuration options (usually from a tsconfig.json) and a bunch of file paths and pipe them through the compiler to answer important questions like “do my files have any errors” and “what’s the JavaScript equivalent of all this TypeScript.” It does that by using the following major components:
- The scanner converts the string text into syntax tokens (read: groups characters into meaningful chunks, like
if,&&,"doggo"), and the parser converts those tokens into a tree structure of nodes. (The root node is called a SourceFile.) - The binder walks through the parse tree and finds declarations (read: places where names of stuff get introduced into some scope, e.g. variable declarations), creating symbols for them, links subsequent usages of those names to existing symbols, and builds a control flow graph.
- The checker gathers all the SourceFiles and walks their parse trees, creating types for symbols and ensuring that the relationships between them make sense.
- The transformer transforms the TypeScript parse tree to a plain JavaScript syntax tree and/or a declaration file syntax tree (stripping away type annotations, converting fancy new syntax ES5-compatible syntax, etc.), and the emitter writes those trees to text.


Know Your Nodes!
If most of that review was new to you, don’t worry! You don’t need to know much more than that to start debugging, and it will make more sense once you dive in. A lot can be picked up on the fly. But, if there’s one thing you might not want to skimp on, it’s learning the proper terminology for syntax. By way of example, you might see the construct x ? y : z and think of the term “ternary operator,” but this sequence is properly called a ConditionalExpression. TypeScript uses the names from the ECMAScript language specification for grammar productions that are valid in JavaScript, but it can be a little tricky to read, and there’s no corresponding document for TypeScript-specific grammar. I often use astexplorer.net (language set to JavaScript, parser set to TypeScript) to jog my memory of what a certain syntax is called and how it’s structured. If you need the reverse, and you’re really stuck—you have a SyntaxKind you’re not familiar with and want to know what code produces it—you can always read the parser! By way of example, if you’re not sure what a TypeQueryNode is, can you get an idea from this?
function parseTypeQuery(): TypeQueryNode {
	const node = createNode(SyntaxKind.TypeQuery) as TypeQueryNode;
	parseExpected(SyntaxKind.TypeOfKeyword);
	node.exprName = parseEntityName(/*allowReservedWords*/ true);
	return finishNode(node);
}
SyntaxKind.TypeOfKeyword followed by an exprName of something called an “entity name”? Yep, it’s the bit after the colon token in const x: typeof y!
Setting Breakpoints by Syntax
The reason you want to be familiar with proper names for syntax is that the parser, binder, checker, transformer, and emitter are in large part a collection of functions with names in the form [verb][SyntaxKind]. Some examples:
parseVariableDeclarationbindCallExpressioncheckComputedPropertyName(GitHub can’t render checker.ts, so I can’t link to the line)transformEnumMemberemitConditionalExpression
This is very frequently the strategy I use to start debugging a problem. We should issue an error on x.badProperty but we don’t? Look for a function in checker.ts called checkPropertyAccessExpression. An expando property assignment fails to create a declaration on its container? Assignment is a form of binary expression, and there are only eight references to SyntaxKind.BinaryExpression in the binder, so one of them should be near the culprit.
Setting Breakpoints by Diagnostic Message
If you have a test case that emits a diagnostic message (read: red squiggly error) you don’t understand, finding the place to set a breakpoint is really easy. Simply run a find-all inside the src directory for a few words of the error message, with spaces replaced by underscores. For example, if you want to find out why you got the message “JSX element 'a' has no corresponding closing tag,” try searching for has_no_corresponding_closing and you’ll find it. Set a breakpoint and work backwards by inspecting up the call stack if necessary.
Be aware that substitutions like 'a' in that error are represented as numerals in the diagnostic property (Diagnostics.JSX_element_0_has_no_corresponding_closing_tag), so you might want to avoid areas of the message that look dynamic or highly specific in your search terms.
Inspecting Stuff while Paused
Finally, now that you know where to pause the debugger, you’ll want to be able to inspect the current state of the compiler. Sure, you’re paused on checkPropertyAccessExpression, but is this the property access expression you’re interested in? Here are a few of the most useful tips for determining just what you’re looking at:
-
Every Node object has a
__debugKindproperty (sincekindis just a number) and a__debugGetText()method. -
You can get a node’s parent node through its
parentproperty. This is really useful in combination with__debugGetText(), as it gives you a printout of the node you’re interested in, surrounded by some context. -
You can skip all the way up to a node’s source file by its
getSourceFile()method. A source file has afileNameproperty, which is really handy for setting conditional breakpoints. -
Many types of object have some sort of bit flags property, set to an inscrutable number at runtime. These usually have an accompanying property like
__debugFlagscontaining a string representation of the flags, but sometimes you wind up in a function with just a variable with the flags value. In those circumstances, you can often find helper functions to format that number into a string underts.Debug: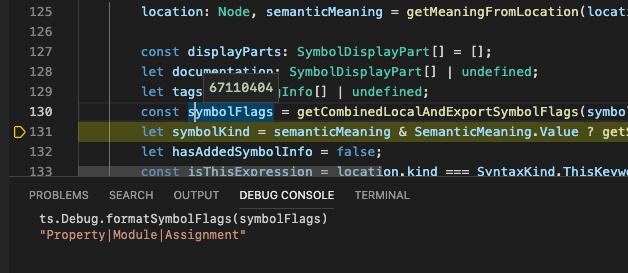
-
You can access a function exported from the
tsnamespace in another file by writing its fully qualified name in the debug console. I feel like this is worth mentioning because at most places in the source code, you can drop thetsprefix and write functions likeisIdentifier(node), but in the debug console, you have to writets.isIdentifier(node).

You’re an expert! Now what?
If this has made contributing to TypeScript feel less daunting, peruse through the issues labeled “good first issue” or “help wanted.” Maybe you’ll find something that inspires you![3]
VS Code’s docs on debugging are good if you’re not familiar with it. ↩︎
I’m not sure why the debugger starts in the built tsc.js file instead of the source tsc.ts file, but once you step into a different file, the debugger will bring up the TypeScript source instead of the built JavaScript. ↩︎
Orta’s typescript-notes also serve well as a first-time contributer’s guide. ↩︎